(Project Gallery)
Screens from the live product

Login
Login
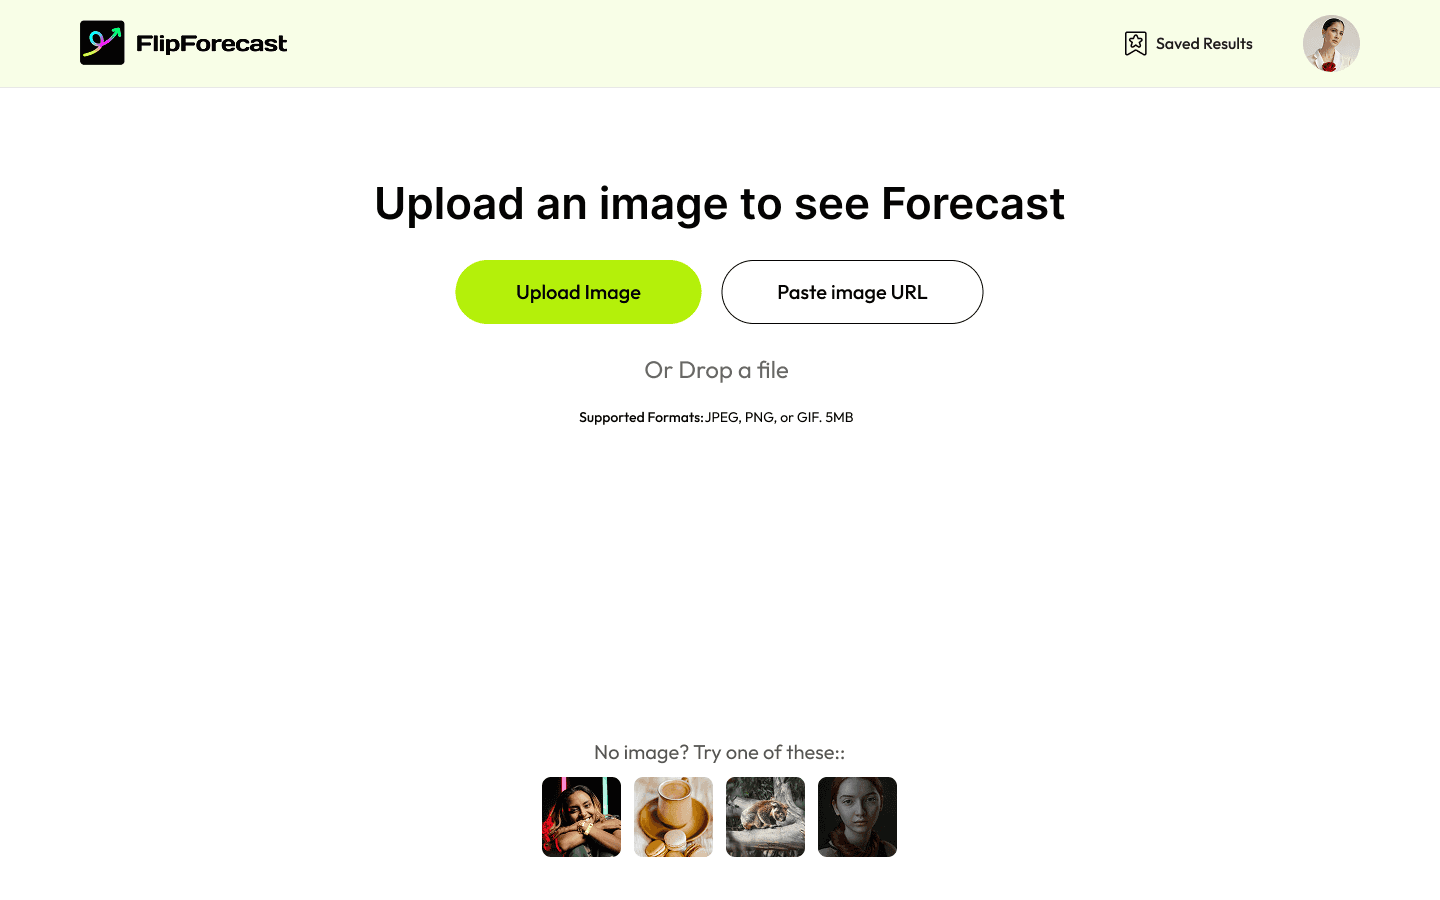
Image Upload
Image Upload
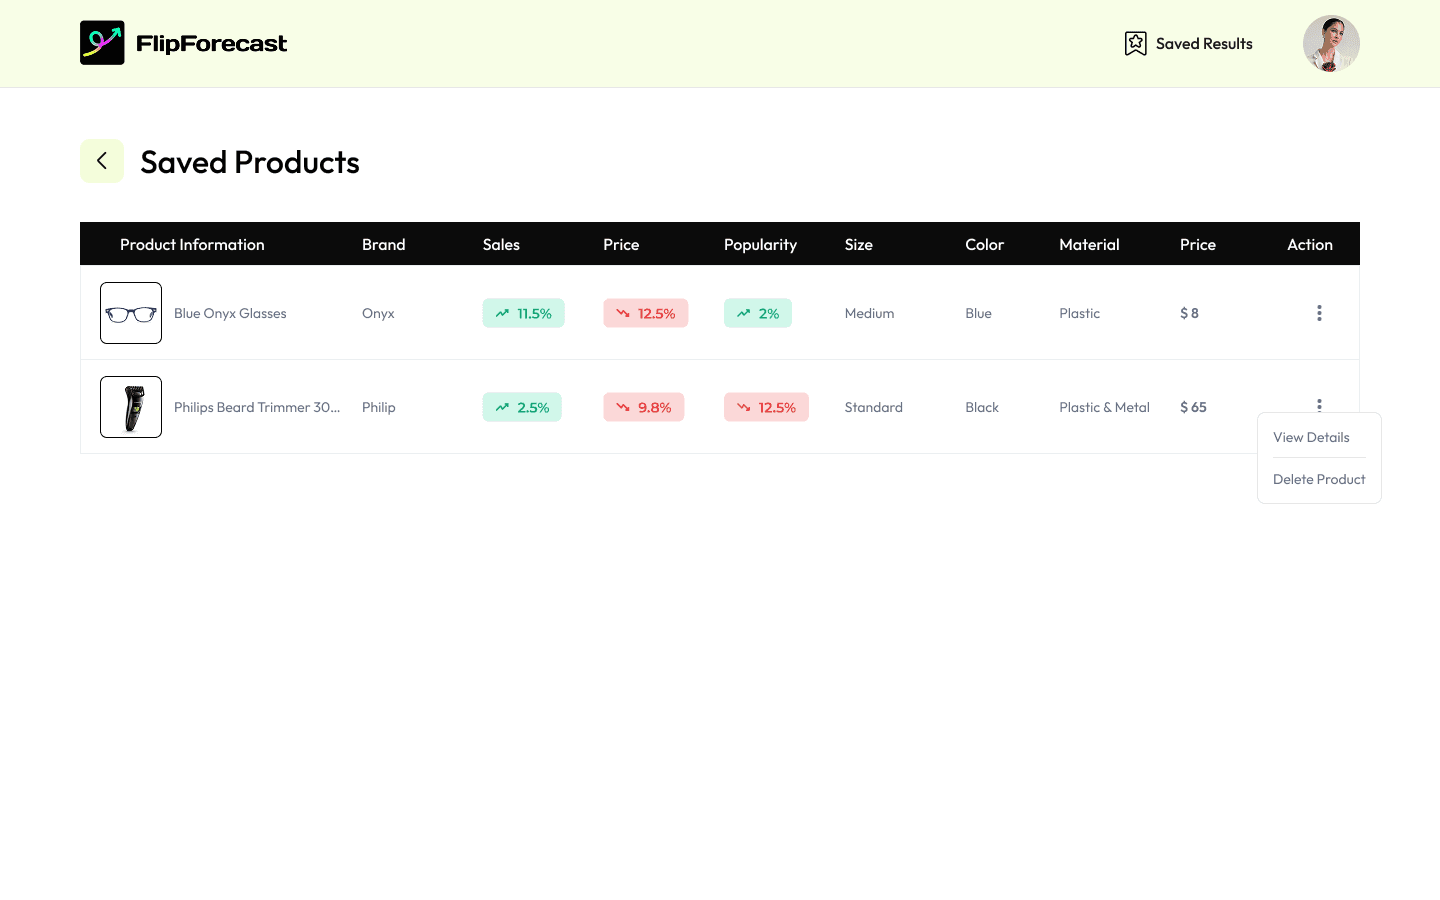
Saved Products
Saved Products
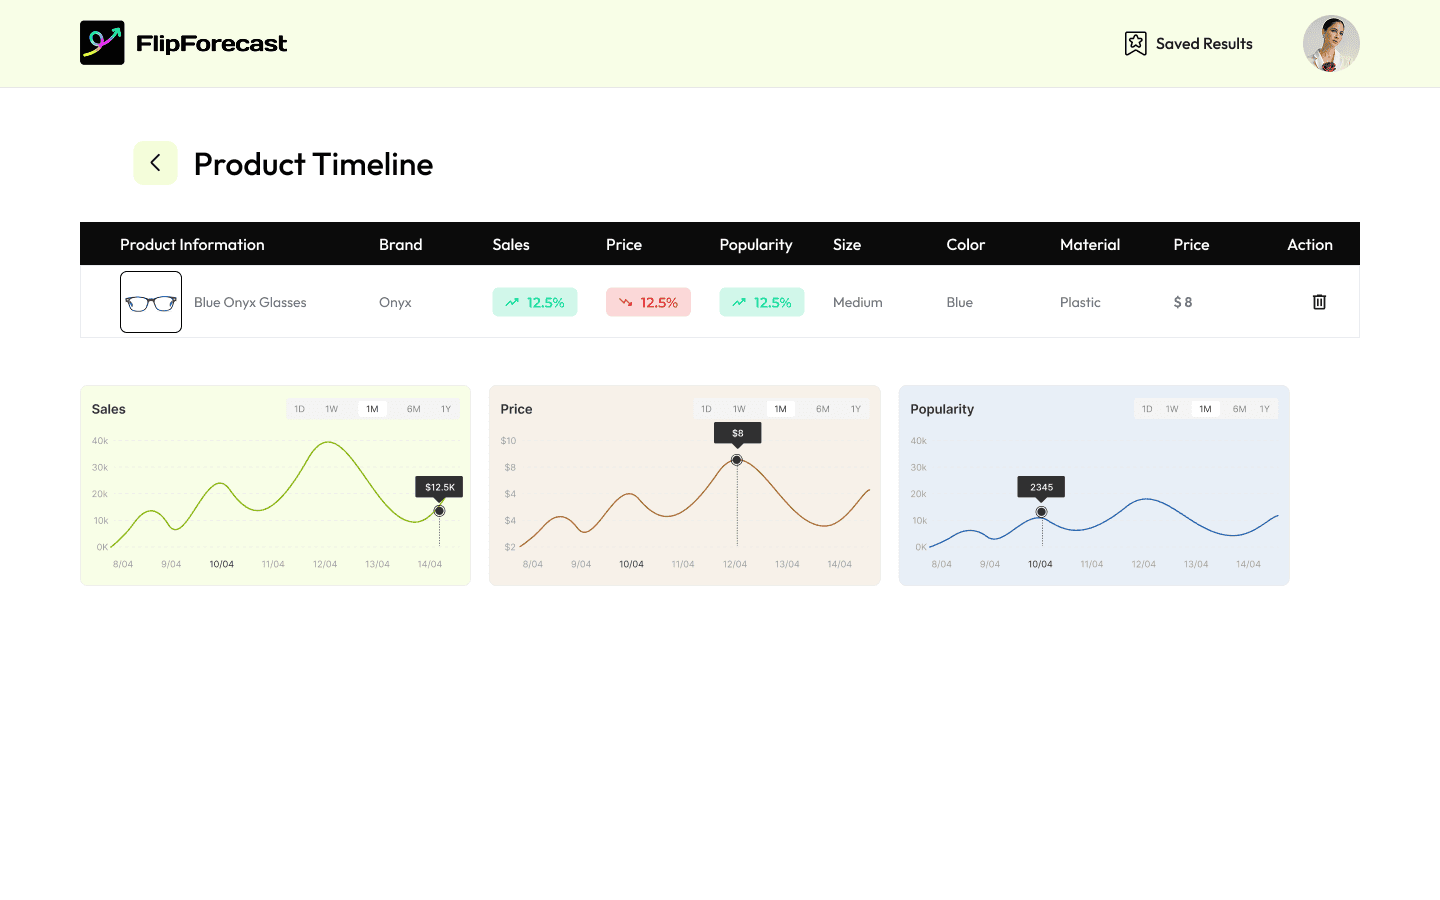
Product Timeline
Product Timeline
An AI-assisted product forecasting tool that lets sellers upload product images, extract product insights, save forecasted results, and review sales, price, and popularity timelines.
Industry
Retail & E-Commerce
Duration
8 weeks
Year
2025
(Project Overview)
Client Background
An e-commerce analytics product built for sellers who need faster product validation and market signal forecasting.
The Challenge
Sellers needed a lightweight way to evaluate product potential from visuals and market signals without manually collecting sales, price, popularity, size, color, and material data across multiple tools.
Our Solution
Built a clean forecasting workflow where users can upload an image or paste an image URL, save forecasted products, and inspect product timelines for sales, price, and popularity trends.
(The Challenge)
01
Staff were spending 6+ hours daily copying data between spreadsheets, supplier emails, and the ERP system — a process prone to errors and delays.
02
Managers had no single view of workflow status. Every update required manually checking multiple systems or calling the operations team.
03
Supplier onboarding involved 12-step email chains. A single missed reply could delay freight clearance by days.
04
The existing ERP had no public API. Any integration had to be built around screen scraping and CSV exports — brittle and slow.
(Our Solution)
FlipForecast was designed around a simple product-discovery loop: sign in, upload a product image, generate a forecast, save promising products, and return later to review their performance signals.
The experience includes a focused upload screen, saved product tables, action menus, and timeline charts that help sellers compare sales, price, and popularity changes at a glance.
What We Built
(Design & Development Process)
01
Stakeholder interviews, workflow mapping, and a full audit of the existing ERP and communication stack. Defined scope, priorities, and success metrics.
Deliverables
02
Wireframed every dashboard screen and workflow builder interaction. High-fidelity Figma prototypes reviewed and approved by the operations team before development began.
Deliverables
03
Sprint-based build with weekly demos. Backend API, n8n workflow engine, and React dashboard built in parallel by dedicated squads with daily standups.
Deliverables
04
End-to-end testing across all workflows, load testing for 500 concurrent automations, UAT with the client's operations team, and accessibility audit.
Deliverables
(Key Features)
Image upload and image URL workflow for product forecasting
Saved results area for storing and reviewing forecasted products
Product information table with brand, sales, price, popularity, size, color, material, and action controls
Product timeline view with sales, price, and popularity charts
Authentication flow with email/password and Google sign-up option
Clean dashboard UI optimized for quick product validation
(Tech Stack)
Every tool chosen for this product’s speed, clarity, and scale.
(Results & Impact)
Automated product insight extraction
AI
Forecast signals visualized
3
Upload input methods
2
Focused product validation flow
100%
Overall Result
FlipForecast gave sellers a streamlined way to turn product images into saved forecasts and timeline insights for sales, price, and popularity decisions.
(Project Gallery)
Login
Login
Image Upload
Image Upload
Saved Products
Saved Products
Product Timeline
Product Timeline
Softlvy transformed our vision into a scalable product. Their team delivered exceptional quality, clear communication, and a smooth development process from start to finish.
David Carter
Founder, SaaS Startup